Understand Kubernetes Telemetry Data Immediately With Mezmo’s Welcome Pipeline


Most vendor trials take quite a bit of effort and time. Now, with Mezmo’s new Welcome Pipeline, you can get results with your Kubernetes telemetry data in just a couple of minutes. But first, let’s discuss why Kubernetes data is such a challenge, and then we’ll overview the steps.
Kubernetes and Business Insights
Kubernetes has become a staple in orchestrating containerized applications. Its robustness makes it excellent for scaling and managing complex systems. However, despite its utility, Kubernetes-deployed applications and infrastructure generate a ton of data. While this data can reveal important key performance indicators (KPIs) like system performance, latency, and user behavior metrics, getting those insights is often tricky due to the volume and complexity of Kubernetes' telemetry data. Extracting insights from this data often means sifting through verbose logs, indecipherable telemetry data, and a jungle of metrics.
The Challenges
- Data Overload: With Kubernetes, you're never short of data. But too much data can be overwhelming, making it hard to find the information you actually need. A good example of this is finding yourself buried in log data, system metrics, and telemetry feedback when all you wanted were key performance indicators (KPIs). Additionally, this high volume of data can increase costs.
- Complexity: Kubernetes is not a monolithic platform. With multiple microservices running, linking data to actual business metrics becomes cumbersome. Tracking a single-user interaction across multiple services would be like finding a needle in a haystack.
- Lack of User-Friendly Tools: Many solutions either provide too much or too little, requiring a steep learning curve or leaving you wanting more. You may encounter tools that flood you with raw data dumps or others that offer an inadequate snapshot— with neither helping you make quick, informed decisions.
Simplify Kubernetes Observability With Our New Welcome Pipeline

Our telemetry pipeline stands as the solution to these issues, presenting a way to harness the raw power of Kubernetes data, delivering actionable insights without the complexities. Our new Welcome Pipeline allows you to see the power, versatility, and potential yourself.
Quick and Easy Setup
With our new Welcome Pipeline, you can start pulling insights in five minutes or less. Just connect your Kubernetes cluster and configure a few settings. It's that simple.
Use the Tools You Know
There is no need to learn (or spend on) a new interface; our pipeline works with popular data observability tools you're likely already using and invested in, like Grafana or Datadog.
Core Value: Actionable Insights
Our pipeline focuses on what matters: delivering insights that help with business decision-making. We do the heavy lifting on the data side so you can concentrate on making informed decisions.
You Choose How to Visualize
We don't lock you into using our visualization tools. Use the ones you're comfortable with and tailor your visualizations to your unique business needs.
Rapid Feature Releases
We focus on delivering new features quickly, specifically features that directly enhance Kubernetes observability. No waiting around for months for crucial updates while we build out a cumbersome UI.
Getting Started: Setting Up Your Welcome Pipeline

Head to Mezmo's sign-up page and start your journey by filling out the sign-up form and checking your email address to verify and access your new account.

Once you’ve accessed your account, you should be at the onboarding screen. From here, you can quickly set up your pipeline:
- Organization: Begin by naming your organization.
- Deploy Collector: Follow the three steps within the onboarding wizard to either install a new collector or configure your existing one.
- View Observability Pipeline: See the pipeline you just configured.
Understanding Your Telemetry Pipeline
Congratulations! At this point, you’ve set up your pipeline and are ready to go. Above (in Figure 1) is what your pipeline would look like with your data. Let’s dive into the components.
We have three major functional areas outlined in our example above that serve as a way for you to learn about the processes you can employ within the pipeline.
Counting Log Lines

In the first section, we focus on the volume of logs coming from our Kubernetes environment. To do this, we create two different metrics:
- node_entry: the number of log entries being produced by each Kubernetes node in our cluster
- log_monitoring: the number of log entries being produced by each container running in our Kubernetes cluster.
In the case of the node_entry metric, we also feed that into an Aggregate processor, which is configured to summarize the metric only every 60 seconds.
Health Sentiment
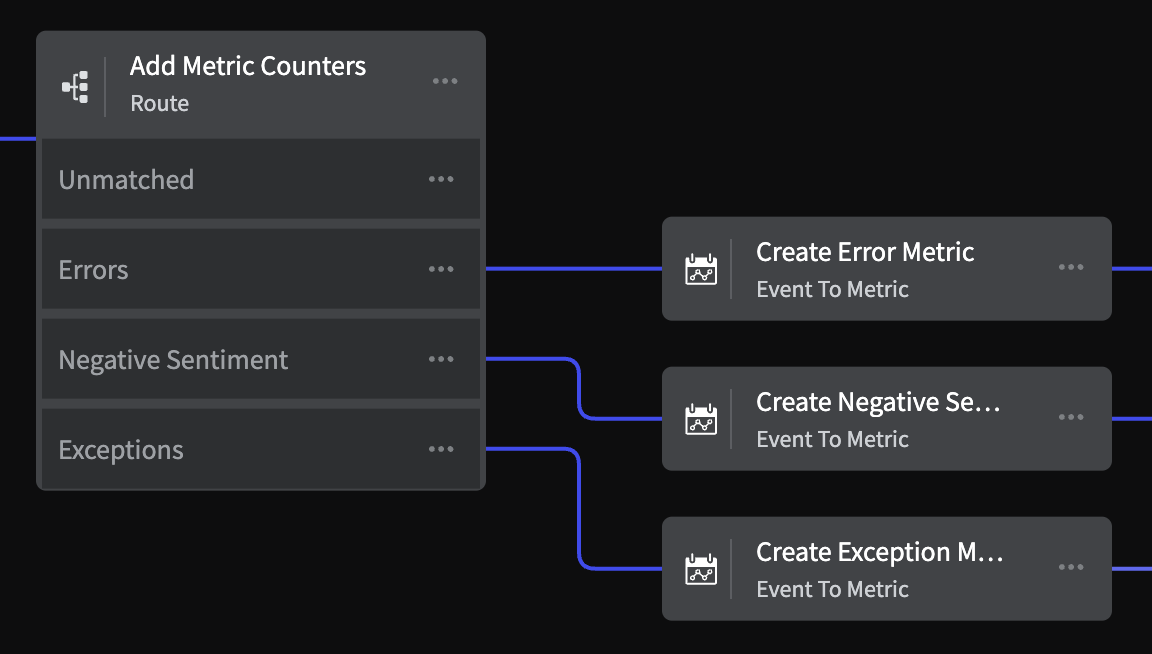
The second section, stemming from the Route processor that adds metric counters, is focused on extracting health sentiments from your log data. Typically, all these metrics hide in your log data. Mezmo makes it easy to extract and understand these health sentiments so you can have a comprehensive view of the health of your Kubernetes system at a glance. For example, in this pipeline, we extract the following health metrics:
- Errors
- Negative Sentiments
- Exceptions
- Out-of-Memory Conditions
- Keyword Filtering
Telemetry Enrichment

The final section sends all of our telemetry data through an enrichment processor that, as a best practice, adds helpful tags to your telemetry data to trace it back to where it was processed. As such, all telemetry flowing through this pipeline will include additional tagging information that will appear in your observability tools to help teams understand where the data came from, what pipeline(s) it flowed through, and most importantly- where they can go to see the pipeline definition:

These processors are preconfigured and will work with any setup you’ve provided in the onboarding.
You can route your data to virtually any observability platform from here. In Figure 1, we highlighted a potential logs consumer and metrics consumer as two examples, but you can replace the above destinations with examples like:
- Grafana: You can feed Grafana the data from Mezmo to construct intuitive dashboards for trend analysis, pinpointing performance hotspots and bottlenecks within your system.
- Datadog: Route data from Mezmo to Datadog for enhanced anomaly detection and streamlined alert management.
- Prometheus Write Endpoint: Channeling telemetry data from Mezmo directly to the Prometheus Write Endpoint ensures real-time data ingestion and swift alert capabilities. You’ll also benefit from instant metric updates and proactive system health checks.

Mezmo offers a custom Grafana dashboard to easily view the data within your pipeline. To import this dashboard inside your Grafana instance, follow these instructions:
- Go to https://grafana.com/grafana/dashboards/.
- Enter “Mezmo” in the search bar.
- Click on the “Mezmo Welcome Dashboard.”
- Click the “Copy ID to Clipboard” Button
- Within your Grafana instance, click on “Dashboards” and then “Import”
- Paste the Dashboard ID and click “Load”
- Select your Prometheus instance where the metrics are being pulled from using the dropdown menu.
- Click “Import”
Take the Next Step
Understanding our telemetry pipeline's power, versatility, and value comes with hands-on experience. Simplify your data processes, attain actionable insights, and make better decisions, all while requiring less than five minutes of setup time.
Get started for free today or talk to a member of our team to see the difference firsthand.


SHARE ARTICLE


RSS FEED

RELATED ARTICLES